|
Download Data (XLS File) |
|
|||||
|
|||||
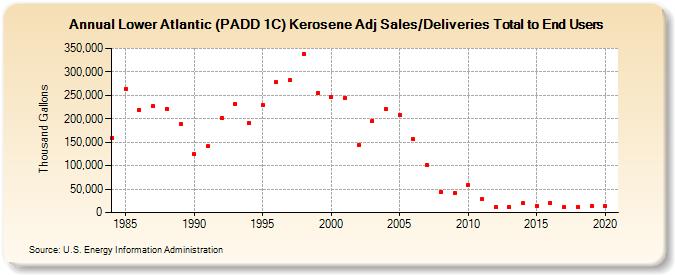
| Lower Atlantic (PADD 1C) Kerosene Adj Sales/Deliveries Total to End Users (Thousand Gallons) | |||||
| Decade | Year-0 | Year-1 | Year-2 | Year-3 | Year-4 | Year-5 | Year-6 | Year-7 | Year-8 | Year-9 |
|---|---|---|---|---|---|---|---|---|---|---|
| 1980's | 158,958 | 264,323 | 219,248 | 226,226 | 221,287 | 188,040 | ||||
| 1990's | 124,107 | 141,305 | 202,488 | 231,994 | 190,167 | 229,082 | 277,282 | 282,114 | 338,467 | 255,494 |
| 2000's | 246,840 | 244,261 | 143,557 | 195,369 | 220,547 | 208,627 | 156,256 | 101,031 | 43,613 | 42,089 |
| 2010's | 58,482 | 28,395 | 11,178 | 11,859 | 19,809 | 14,798 | 21,079 | 10,836 | 12,759 | 13,658 |
| 2020's | 13,854 |
| - = No Data Reported; -- = Not Applicable; NA = Not Available; W = Withheld to avoid disclosure of individual company data. |
| Release Date: 2/9/2022 |
| Next Release Date: Suspended |