|
Download Data (XLS File) |
|
|||||
|
|||||
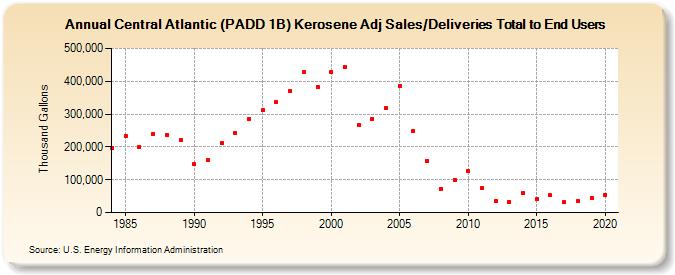
| Central Atlantic (PADD 1B) Kerosene Adj Sales/Deliveries Total to End Users (Thousand Gallons) | |||||
| Decade | Year-0 | Year-1 | Year-2 | Year-3 | Year-4 | Year-5 | Year-6 | Year-7 | Year-8 | Year-9 |
|---|---|---|---|---|---|---|---|---|---|---|
| 1980's | 196,546 | 234,141 | 199,855 | 240,194 | 237,027 | 220,643 | ||||
| 1990's | 146,845 | 158,888 | 211,859 | 242,340 | 285,790 | 310,972 | 335,421 | 371,224 | 428,225 | 382,222 |
| 2000's | 428,040 | 444,346 | 265,320 | 286,012 | 318,483 | 386,392 | 249,906 | 158,099 | 73,140 | 100,012 |
| 2010's | 125,552 | 75,346 | 35,913 | 33,476 | 59,685 | 40,820 | 52,690 | 31,178 | 34,252 | 45,225 |
| 2020's | 53,583 |
| - = No Data Reported; -- = Not Applicable; NA = Not Available; W = Withheld to avoid disclosure of individual company data. |
| Release Date: 2/9/2022 |
| Next Release Date: Suspended |