|
Download Data (XLS File) |
|
|||||
|
|||||
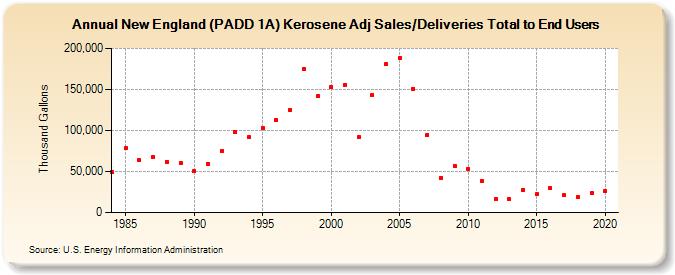
| New England (PADD 1A) Kerosene Adj Sales/Deliveries Total to End Users (Thousand Gallons) | |||||
| Decade | Year-0 | Year-1 | Year-2 | Year-3 | Year-4 | Year-5 | Year-6 | Year-7 | Year-8 | Year-9 |
|---|---|---|---|---|---|---|---|---|---|---|
| 1980's | 48,998 | 78,155 | 63,562 | 67,484 | 62,150 | 60,961 | ||||
| 1990's | 50,474 | 59,495 | 75,567 | 98,522 | 91,504 | 103,401 | 113,046 | 125,286 | 174,493 | 141,954 |
| 2000's | 152,872 | 155,414 | 91,585 | 143,435 | 181,193 | 188,821 | 150,912 | 94,635 | 42,570 | 56,661 |
| 2010's | 53,363 | 38,448 | 15,983 | 15,991 | 27,500 | 22,215 | 29,873 | 20,852 | 18,856 | 23,802 |
| 2020's | 26,138 |
| - = No Data Reported; -- = Not Applicable; NA = Not Available; W = Withheld to avoid disclosure of individual company data. |
| Release Date: 2/9/2022 |
| Next Release Date: Suspended |