|
Download Data (XLS File) |
|
|||||
|
|||||
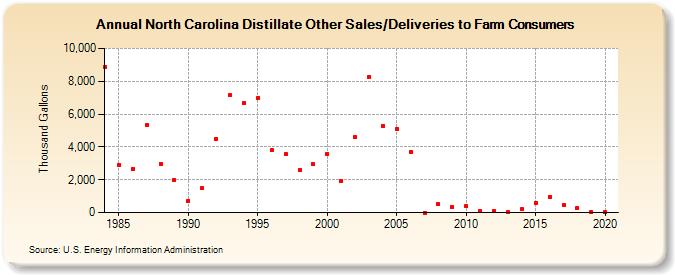
| North Carolina Distillate Other Sales/Deliveries to Farm Consumers (Thousand Gallons) | |||||
| Decade | Year-0 | Year-1 | Year-2 | Year-3 | Year-4 | Year-5 | Year-6 | Year-7 | Year-8 | Year-9 |
|---|---|---|---|---|---|---|---|---|---|---|
| 1980's | 8,869 | 2,887 | 2,663 | 5,346 | 2,968 | 1,989 | ||||
| 1990's | 724 | 1,480 | 4,494 | 7,151 | 6,665 | 7,001 | 3,800 | 3,573 | 2,608 | 2,941 |
| 2000's | 3,577 | 1,950 | 4,598 | 8,271 | 5,301 | 5,099 | 3,704 | 0 | 508 | 349 |
| 2010's | 383 | 83 | 109 | 10 | 193 | 610 | 978 | 470 | 270 | 39 |
| 2020's | 51 |
| - = No Data Reported; -- = Not Applicable; NA = Not Available; W = Withheld to avoid disclosure of individual company data. |
| Release Date: 2/9/2022 |
| Next Release Date: Suspended |