|
Download Data (XLS File) |
|
|||||
|
|||||
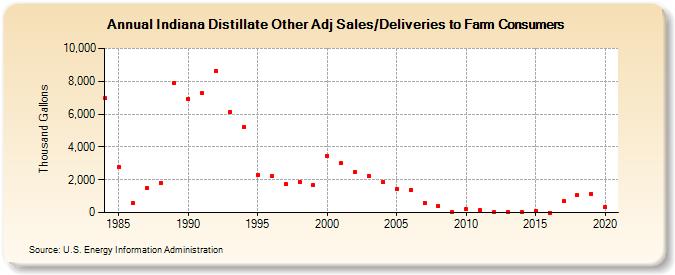
| Indiana Distillate Other Adj Sales/Deliveries to Farm Consumers (Thousand Gallons) | |||||
| Decade | Year-0 | Year-1 | Year-2 | Year-3 | Year-4 | Year-5 | Year-6 | Year-7 | Year-8 | Year-9 |
|---|---|---|---|---|---|---|---|---|---|---|
| 1980's | 6,959 | 2,781 | 585 | 1,509 | 1,804 | 7,916 | ||||
| 1990's | 6,919 | 7,254 | 8,609 | 6,140 | 5,219 | 2,307 | 2,217 | 1,722 | 1,854 | 1,665 |
| 2000's | 3,454 | 3,011 | 2,468 | 2,233 | 1,860 | 1,438 | 1,380 | 597 | 402 | 20 |
| 2010's | 198 | 148 | 6 | 7 | 8 | 102 | 0 | 702 | 1,055 | 1,142 |
| 2020's | 328 |
| - = No Data Reported; -- = Not Applicable; NA = Not Available; W = Withheld to avoid disclosure of individual company data. |
| Release Date: 2/9/2022 |
| Next Release Date: Suspended |