|
Download Data (XLS File) |
|
|||||
|
|||||
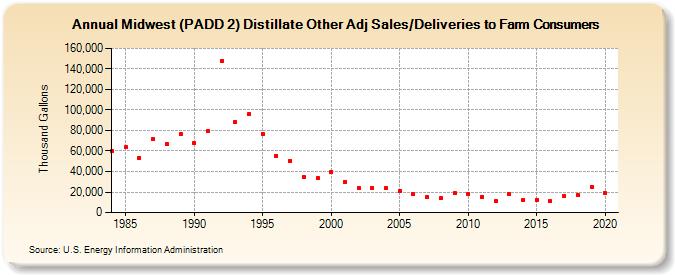
| Midwest (PADD 2) Distillate Other Adj Sales/Deliveries to Farm Consumers (Thousand Gallons) | |||||
| Decade | Year-0 | Year-1 | Year-2 | Year-3 | Year-4 | Year-5 | Year-6 | Year-7 | Year-8 | Year-9 |
|---|---|---|---|---|---|---|---|---|---|---|
| 1980's | 59,602 | 63,697 | 53,621 | 71,681 | 66,900 | 76,265 | ||||
| 1990's | 67,520 | 79,093 | 148,144 | 88,133 | 95,946 | 76,763 | 55,457 | 50,570 | 34,662 | 33,544 |
| 2000's | 39,568 | 30,132 | 23,541 | 23,615 | 23,560 | 20,807 | 17,665 | 14,982 | 13,927 | 18,979 |
| 2010's | 18,574 | 15,487 | 10,930 | 17,814 | 12,598 | 12,669 | 11,186 | 15,654 | 17,442 | 24,912 |
| 2020's | 18,623 |
| - = No Data Reported; -- = Not Applicable; NA = Not Available; W = Withheld to avoid disclosure of individual company data. |
| Release Date: 2/9/2022 |
| Next Release Date: Suspended |