|
Download Data (XLS File) |
|
|||||
|
|||||
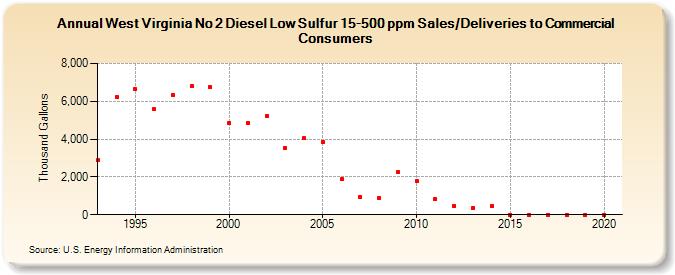
| West Virginia No 2 Diesel Low Sulfur 15-500 ppm Sales/Deliveries to Commercial Consumers (Thousand Gallons) | |||||
| Decade | Year-0 | Year-1 | Year-2 | Year-3 | Year-4 | Year-5 | Year-6 | Year-7 | Year-8 | Year-9 |
|---|---|---|---|---|---|---|---|---|---|---|
| 1990's | 2,873 | 6,217 | 6,648 | 5,568 | 6,345 | 6,789 | 6,746 | |||
| 2000's | 4,858 | 4,829 | 5,215 | 3,551 | 4,042 | 3,859 | 1,889 | 940 | 862 | 2,241 |
| 2010's | 1,797 | 810 | 479 | 375 | 453 | 2 | 0 | 0 | 0 | 0 |
| 2020's | 0 |
| - = No Data Reported; -- = Not Applicable; NA = Not Available; W = Withheld to avoid disclosure of individual company data. |
| Release Date: 2/9/2022 |
| Next Release Date: Suspended |