|
Download Data (XLS File) |
|
|||||
|
|||||
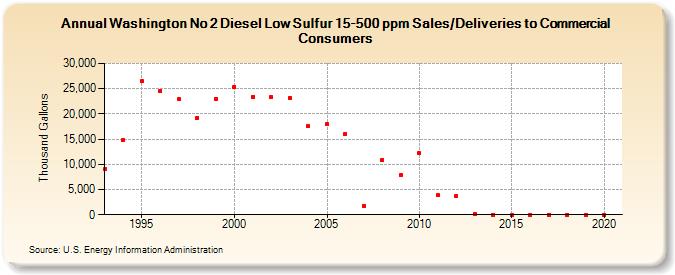
| Washington No 2 Diesel Low Sulfur 15-500 ppm Sales/Deliveries to Commercial Consumers (Thousand Gallons) | |||||
| Decade | Year-0 | Year-1 | Year-2 | Year-3 | Year-4 | Year-5 | Year-6 | Year-7 | Year-8 | Year-9 |
|---|---|---|---|---|---|---|---|---|---|---|
| 1990's | 9,083 | 14,869 | 26,487 | 24,593 | 22,931 | 19,276 | 23,031 | |||
| 2000's | 25,432 | 23,427 | 23,332 | 23,221 | 17,543 | 17,911 | 15,974 | 1,791 | 10,855 | 7,872 |
| 2010's | 12,156 | 3,831 | 3,706 | 185 | 0 | 0 | 0 | 0 | 0 | 0 |
| 2020's | 0 |
| - = No Data Reported; -- = Not Applicable; NA = Not Available; W = Withheld to avoid disclosure of individual company data. |
| Release Date: 2/9/2022 |
| Next Release Date: Suspended |