|
Download Data (XLS File) |
|
|||||
|
|||||
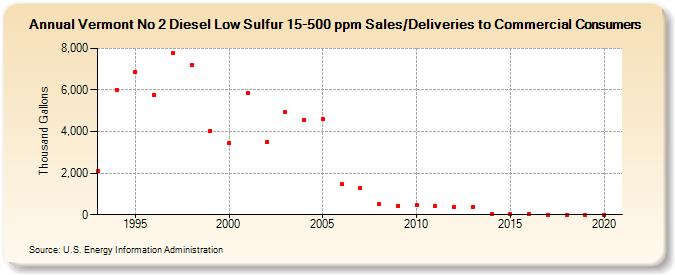
| Vermont No 2 Diesel Low Sulfur 15-500 ppm Sales/Deliveries to Commercial Consumers (Thousand Gallons) | |||||
| Decade | Year-0 | Year-1 | Year-2 | Year-3 | Year-4 | Year-5 | Year-6 | Year-7 | Year-8 | Year-9 |
|---|---|---|---|---|---|---|---|---|---|---|
| 1990's | 2,079 | 6,019 | 6,881 | 5,747 | 7,773 | 7,215 | 4,050 | |||
| 2000's | 3,449 | 5,841 | 3,501 | 4,941 | 4,572 | 4,587 | 1,465 | 1,267 | 534 | 442 |
| 2010's | 448 | 415 | 391 | 375 | 52 | 21 | 17 | 0 | 0 | 0 |
| 2020's | 0 |
| - = No Data Reported; -- = Not Applicable; NA = Not Available; W = Withheld to avoid disclosure of individual company data. |
| Release Date: 2/9/2022 |
| Next Release Date: Suspended |