|
Download Data (XLS File) |
|
|||||
|
|||||
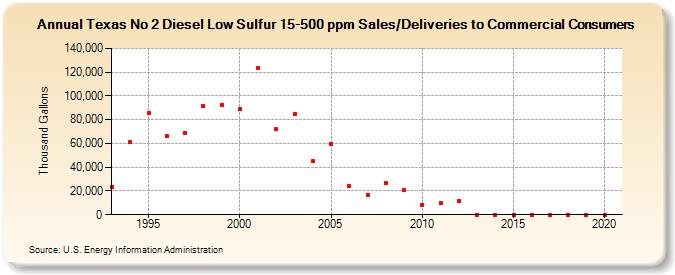
| Texas No 2 Diesel Low Sulfur 15-500 ppm Sales/Deliveries to Commercial Consumers (Thousand Gallons) | |||||
| Decade | Year-0 | Year-1 | Year-2 | Year-3 | Year-4 | Year-5 | Year-6 | Year-7 | Year-8 | Year-9 |
|---|---|---|---|---|---|---|---|---|---|---|
| 1990's | 23,658 | 60,912 | 85,692 | 66,395 | 68,600 | 91,618 | 92,721 | |||
| 2000's | 88,607 | 123,842 | 72,030 | 84,444 | 45,200 | 59,737 | 24,089 | 16,897 | 26,528 | 20,699 |
| 2010's | 8,413 | 10,016 | 11,826 | 0 | 13 | 0 | 0 | 0 | 0 | 0 |
| 2020's | 0 |
| - = No Data Reported; -- = Not Applicable; NA = Not Available; W = Withheld to avoid disclosure of individual company data. |
| Release Date: 2/9/2022 |
| Next Release Date: Suspended |