|
Download Data (XLS File) |
|
|||||
|
|||||
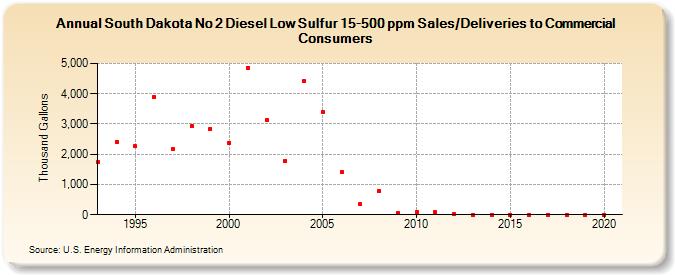
| South Dakota No 2 Diesel Low Sulfur 15-500 ppm Sales/Deliveries to Commercial Consumers (Thousand Gallons) | |||||
| Decade | Year-0 | Year-1 | Year-2 | Year-3 | Year-4 | Year-5 | Year-6 | Year-7 | Year-8 | Year-9 |
|---|---|---|---|---|---|---|---|---|---|---|
| 1990's | 1,754 | 2,404 | 2,259 | 3,894 | 2,157 | 2,934 | 2,844 | |||
| 2000's | 2,383 | 4,862 | 3,133 | 1,772 | 4,425 | 3,391 | 1,411 | 342 | 790 | 62 |
| 2010's | 85 | 74 | 16 | 0 | 0 | 0 | 0 | 0 | 0 | 0 |
| 2020's | 0 |
| - = No Data Reported; -- = Not Applicable; NA = Not Available; W = Withheld to avoid disclosure of individual company data. |
| Release Date: 2/9/2022 |
| Next Release Date: Suspended |