|
Download Data (XLS File) |
|
|||||
|
|||||
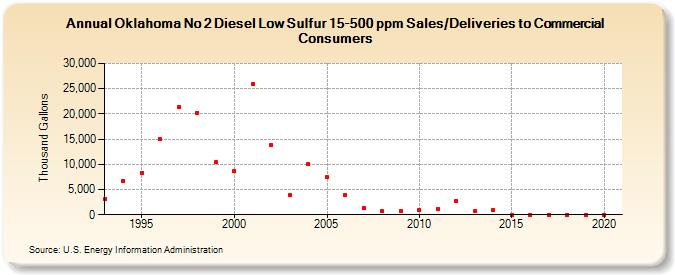
| Oklahoma No 2 Diesel Low Sulfur 15-500 ppm Sales/Deliveries to Commercial Consumers (Thousand Gallons) | |||||
| Decade | Year-0 | Year-1 | Year-2 | Year-3 | Year-4 | Year-5 | Year-6 | Year-7 | Year-8 | Year-9 |
|---|---|---|---|---|---|---|---|---|---|---|
| 1990's | 3,165 | 6,751 | 8,353 | 14,996 | 21,445 | 20,231 | 10,363 | |||
| 2000's | 8,623 | 25,946 | 13,865 | 3,872 | 10,028 | 7,442 | 3,918 | 1,277 | 731 | 684 |
| 2010's | 940 | 1,154 | 2,726 | 796 | 1,001 | 0 | 0 | 0 | 0 | 0 |
| 2020's | 0 |
| - = No Data Reported; -- = Not Applicable; NA = Not Available; W = Withheld to avoid disclosure of individual company data. |
| Release Date: 2/9/2022 |
| Next Release Date: Suspended |