|
Download Data (XLS File) |
|
|||||
|
|||||
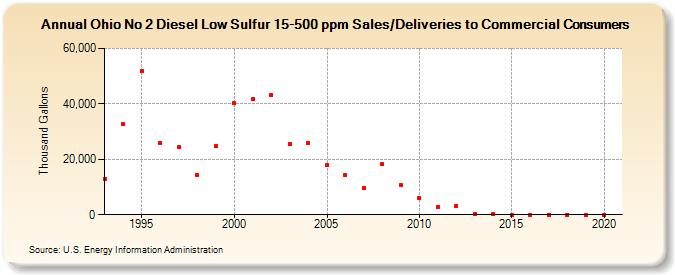
| Ohio No 2 Diesel Low Sulfur 15-500 ppm Sales/Deliveries to Commercial Consumers (Thousand Gallons) | |||||
| Decade | Year-0 | Year-1 | Year-2 | Year-3 | Year-4 | Year-5 | Year-6 | Year-7 | Year-8 | Year-9 |
|---|---|---|---|---|---|---|---|---|---|---|
| 1990's | 12,779 | 32,627 | 51,891 | 25,745 | 24,604 | 14,265 | 24,813 | |||
| 2000's | 40,200 | 41,713 | 43,236 | 25,646 | 25,982 | 17,887 | 14,226 | 9,746 | 18,279 | 10,564 |
| 2010's | 6,068 | 2,927 | 3,068 | 406 | 205 | 0 | 0 | 0 | 0 | 0 |
| 2020's | 0 |
| - = No Data Reported; -- = Not Applicable; NA = Not Available; W = Withheld to avoid disclosure of individual company data. |
| Release Date: 2/9/2022 |
| Next Release Date: Suspended |