|
Download Data (XLS File) |
|
|||||
|
|||||
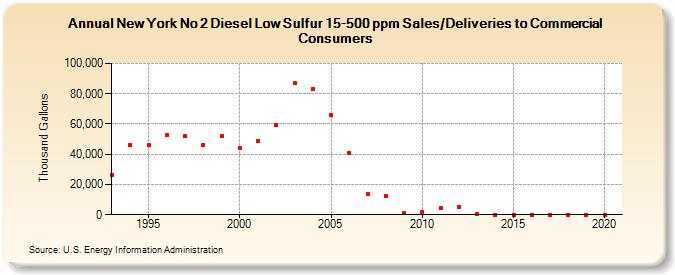
| New York No 2 Diesel Low Sulfur 15-500 ppm Sales/Deliveries to Commercial Consumers (Thousand Gallons) | |||||
| Decade | Year-0 | Year-1 | Year-2 | Year-3 | Year-4 | Year-5 | Year-6 | Year-7 | Year-8 | Year-9 |
|---|---|---|---|---|---|---|---|---|---|---|
| 1990's | 26,036 | 46,272 | 46,030 | 52,940 | 51,836 | 46,305 | 51,733 | |||
| 2000's | 43,829 | 48,763 | 59,622 | 86,917 | 83,170 | 65,855 | 40,494 | 13,762 | 12,245 | 1,192 |
| 2010's | 1,999 | 4,550 | 4,783 | 408 | 79 | 62 | 0 | 0 | 0 | 0 |
| 2020's | 0 |
| - = No Data Reported; -- = Not Applicable; NA = Not Available; W = Withheld to avoid disclosure of individual company data. |
| Release Date: 2/9/2022 |
| Next Release Date: Suspended |