|
Download Data (XLS File) |
|
|||||
|
|||||
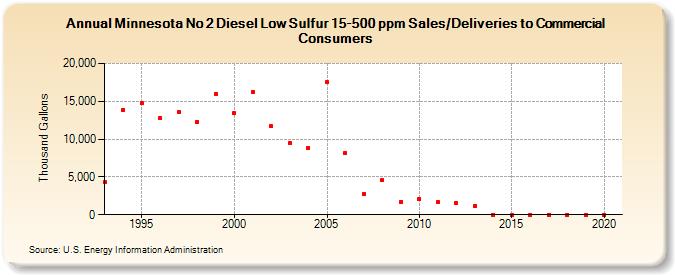
| Minnesota No 2 Diesel Low Sulfur 15-500 ppm Sales/Deliveries to Commercial Consumers (Thousand Gallons) | |||||
| Decade | Year-0 | Year-1 | Year-2 | Year-3 | Year-4 | Year-5 | Year-6 | Year-7 | Year-8 | Year-9 |
|---|---|---|---|---|---|---|---|---|---|---|
| 1990's | 4,267 | 13,824 | 14,748 | 12,762 | 13,566 | 12,323 | 16,020 | |||
| 2000's | 13,399 | 16,224 | 11,691 | 9,540 | 8,884 | 17,535 | 8,153 | 2,803 | 4,582 | 1,733 |
| 2010's | 2,086 | 1,671 | 1,488 | 1,128 | 0 | 0 | 0 | 0 | 0 | 0 |
| 2020's | 0 |
| - = No Data Reported; -- = Not Applicable; NA = Not Available; W = Withheld to avoid disclosure of individual company data. |
| Release Date: 2/9/2022 |
| Next Release Date: Suspended |