|
Download Data (XLS File) |
|
|||||
|
|||||
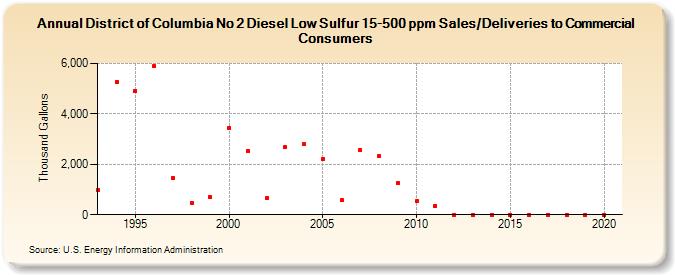
| District of Columbia No 2 Diesel Low Sulfur 15-500 ppm Sales/Deliveries to Commercial Consumers (Thousand Gallons) | |||||
| Decade | Year-0 | Year-1 | Year-2 | Year-3 | Year-4 | Year-5 | Year-6 | Year-7 | Year-8 | Year-9 |
|---|---|---|---|---|---|---|---|---|---|---|
| 1990's | 989 | 5,279 | 4,910 | 5,900 | 1,454 | 473 | 695 | |||
| 2000's | 3,436 | 2,513 | 646 | 2,685 | 2,792 | 2,206 | 564 | 2,559 | 2,315 | 1,253 |
| 2010's | 543 | 354 | 0 | 0 | 0 | 0 | 0 | 0 | 0 | 0 |
| 2020's | 0 |
| - = No Data Reported; -- = Not Applicable; NA = Not Available; W = Withheld to avoid disclosure of individual company data. |
| Release Date: 2/9/2022 |
| Next Release Date: Suspended |