|
Download Data (XLS File) |
|
|||||
|
|||||
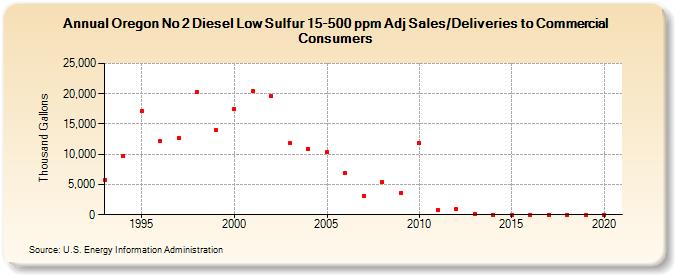
| Oregon No 2 Diesel Low Sulfur 15-500 ppm Adj Sales/Deliveries to Commercial Consumers (Thousand Gallons) | |||||
| Decade | Year-0 | Year-1 | Year-2 | Year-3 | Year-4 | Year-5 | Year-6 | Year-7 | Year-8 | Year-9 |
|---|---|---|---|---|---|---|---|---|---|---|
| 1990's | 5,814 | 9,766 | 17,203 | 12,202 | 12,655 | 20,312 | 14,046 | |||
| 2000's | 17,445 | 20,442 | 19,544 | 11,790 | 10,906 | 10,384 | 6,891 | 3,136 | 5,367 | 3,662 |
| 2010's | 11,791 | 739 | 931 | 198 | 0 | 0 | 0 | 0 | 0 | 0 |
| 2020's | 0 |
| - = No Data Reported; -- = Not Applicable; NA = Not Available; W = Withheld to avoid disclosure of individual company data. |
| Release Date: 2/9/2022 |
| Next Release Date: Suspended |