|
Download Data (XLS File) |
|
|||||
|
|||||
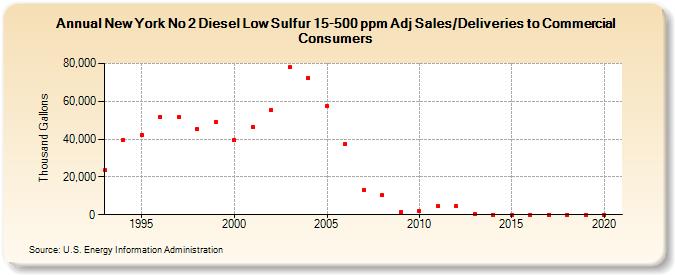
| New York No 2 Diesel Low Sulfur 15-500 ppm Adj Sales/Deliveries to Commercial Consumers (Thousand Gallons) | |||||
| Decade | Year-0 | Year-1 | Year-2 | Year-3 | Year-4 | Year-5 | Year-6 | Year-7 | Year-8 | Year-9 |
|---|---|---|---|---|---|---|---|---|---|---|
| 1990's | 23,504 | 39,742 | 42,426 | 51,913 | 51,624 | 45,117 | 49,252 | |||
| 2000's | 39,492 | 46,354 | 55,439 | 77,961 | 72,562 | 57,427 | 37,448 | 13,309 | 10,409 | 1,259 |
| 2010's | 1,955 | 4,630 | 4,373 | 428 | 85 | 62 | 0 | 0 | 0 | 0 |
| 2020's | 0 |
| - = No Data Reported; -- = Not Applicable; NA = Not Available; W = Withheld to avoid disclosure of individual company data. |
| Release Date: 2/9/2022 |
| Next Release Date: Suspended |