|
Download Data (XLS File) |
|
|||||
|
|||||
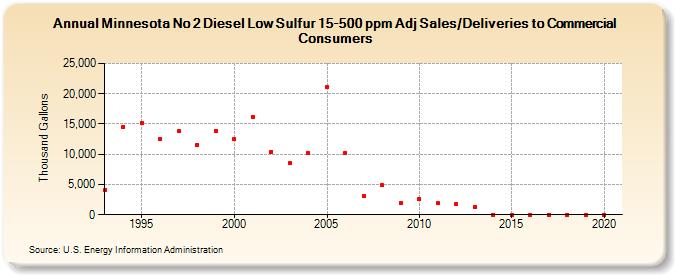
| Minnesota No 2 Diesel Low Sulfur 15-500 ppm Adj Sales/Deliveries to Commercial Consumers (Thousand Gallons) | |||||
| Decade | Year-0 | Year-1 | Year-2 | Year-3 | Year-4 | Year-5 | Year-6 | Year-7 | Year-8 | Year-9 |
|---|---|---|---|---|---|---|---|---|---|---|
| 1990's | 4,094 | 14,504 | 15,174 | 12,508 | 13,870 | 11,598 | 13,812 | |||
| 2000's | 12,511 | 16,183 | 10,421 | 8,519 | 10,175 | 21,167 | 10,215 | 3,083 | 4,865 | 1,972 |
| 2010's | 2,573 | 1,891 | 1,746 | 1,256 | 0 | 0 | 0 | 0 | 0 | 0 |
| 2020's | 0 |
| - = No Data Reported; -- = Not Applicable; NA = Not Available; W = Withheld to avoid disclosure of individual company data. |
| Release Date: 2/9/2022 |
| Next Release Date: Suspended |