|
Download Data (XLS File) |
|
|||||
|
|||||
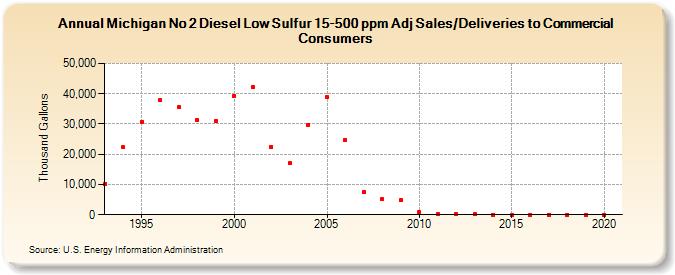
| Michigan No 2 Diesel Low Sulfur 15-500 ppm Adj Sales/Deliveries to Commercial Consumers (Thousand Gallons) | |||||
| Decade | Year-0 | Year-1 | Year-2 | Year-3 | Year-4 | Year-5 | Year-6 | Year-7 | Year-8 | Year-9 |
|---|---|---|---|---|---|---|---|---|---|---|
| 1990's | 10,227 | 22,225 | 30,785 | 37,829 | 35,546 | 31,227 | 31,130 | |||
| 2000's | 39,166 | 42,063 | 22,312 | 16,960 | 29,780 | 38,805 | 24,625 | 7,509 | 5,070 | 4,775 |
| 2010's | 776 | 134 | 86 | 101 | 0 | 0 | 0 | 0 | 0 | 0 |
| 2020's | 0 |
| - = No Data Reported; -- = Not Applicable; NA = Not Available; W = Withheld to avoid disclosure of individual company data. |
| Release Date: 2/9/2022 |
| Next Release Date: Suspended |