|
Download Data (XLS File) |
|
|||||
|
|||||
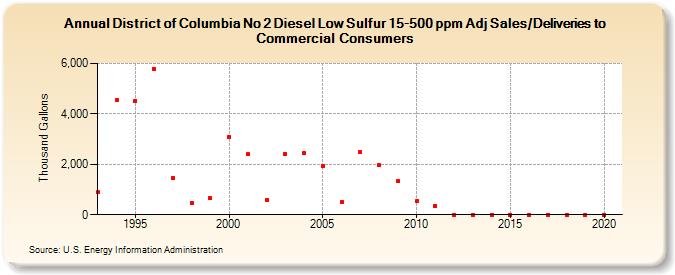
| District of Columbia No 2 Diesel Low Sulfur 15-500 ppm Adj Sales/Deliveries to Commercial Consumers (Thousand Gallons) | |||||
| Decade | Year-0 | Year-1 | Year-2 | Year-3 | Year-4 | Year-5 | Year-6 | Year-7 | Year-8 | Year-9 |
|---|---|---|---|---|---|---|---|---|---|---|
| 1990's | 893 | 4,534 | 4,526 | 5,785 | 1,449 | 461 | 662 | |||
| 2000's | 3,096 | 2,389 | 601 | 2,409 | 2,436 | 1,924 | 521 | 2,475 | 1,968 | 1,323 |
| 2010's | 531 | 361 | 0 | 0 | 0 | 0 | 0 | 0 | 0 | 0 |
| 2020's | 0 |
| - = No Data Reported; -- = Not Applicable; NA = Not Available; W = Withheld to avoid disclosure of individual company data. |
| Release Date: 2/9/2022 |
| Next Release Date: Suspended |