|
Download Data (XLS File) |
|
|||||
|
|||||
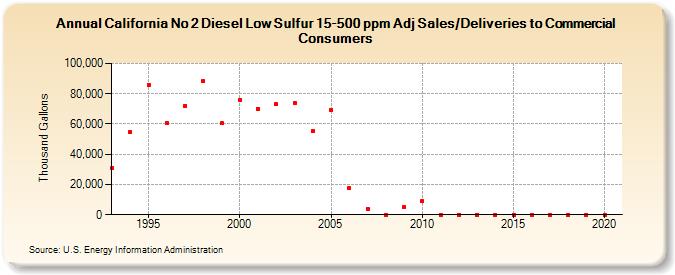
| California No 2 Diesel Low Sulfur 15-500 ppm Adj Sales/Deliveries to Commercial Consumers (Thousand Gallons) | |||||
| Decade | Year-0 | Year-1 | Year-2 | Year-3 | Year-4 | Year-5 | Year-6 | Year-7 | Year-8 | Year-9 |
|---|---|---|---|---|---|---|---|---|---|---|
| 1990's | 30,711 | 54,848 | 85,881 | 60,896 | 72,086 | 88,501 | 60,315 | |||
| 2000's | 76,012 | 70,113 | 72,974 | 74,002 | 55,399 | 69,571 | 17,714 | 3,984 | 35 | 5,100 |
| 2010's | 9,048 | 0 | 11 | 0 | 0 | 0 | 0 | 0 | 0 | 0 |
| 2020's | 0 |
| - = No Data Reported; -- = Not Applicable; NA = Not Available; W = Withheld to avoid disclosure of individual company data. |
| Release Date: 2/9/2022 |
| Next Release Date: Suspended |