|
Download Data (XLS File) |
|
|||||
|
|||||
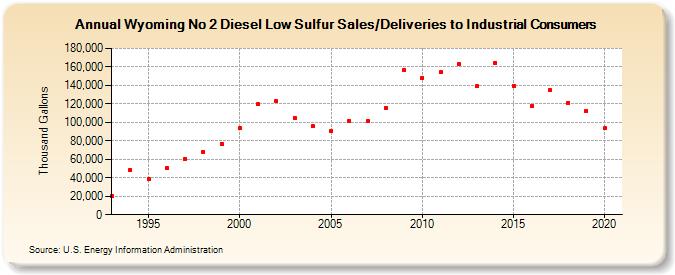
| Wyoming No 2 Diesel Low Sulfur Sales/Deliveries to Industrial Consumers (Thousand Gallons) | |||||
| Decade | Year-0 | Year-1 | Year-2 | Year-3 | Year-4 | Year-5 | Year-6 | Year-7 | Year-8 | Year-9 |
|---|---|---|---|---|---|---|---|---|---|---|
| 1990's | 19,978 | 48,869 | 38,636 | 50,788 | 60,152 | 67,969 | 76,912 | |||
| 2000's | 93,305 | 119,485 | 122,762 | 104,738 | 95,726 | 90,057 | 101,657 | 101,442 | 115,740 | 156,995 |
| 2010's | 148,242 | 154,000 | 162,781 | 138,939 | 164,552 | 139,515 | 117,628 | 134,763 | 121,433 | 112,612 |
| 2020's | 93,462 |
| - = No Data Reported; -- = Not Applicable; NA = Not Available; W = Withheld to avoid disclosure of individual company data. |
| Release Date: 2/9/2022 |
| Next Release Date: Suspended |