|
Download Data (XLS File) |
|
|||||
|
|||||
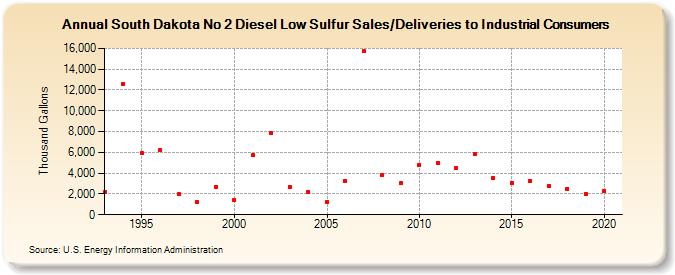
| South Dakota No 2 Diesel Low Sulfur Sales/Deliveries to Industrial Consumers (Thousand Gallons) | |||||
| Decade | Year-0 | Year-1 | Year-2 | Year-3 | Year-4 | Year-5 | Year-6 | Year-7 | Year-8 | Year-9 |
|---|---|---|---|---|---|---|---|---|---|---|
| 1990's | 2,172 | 12,606 | 5,925 | 6,216 | 1,983 | 1,243 | 2,713 | |||
| 2000's | 1,406 | 5,712 | 7,828 | 2,692 | 2,179 | 1,235 | 3,231 | 15,709 | 3,802 | 3,017 |
| 2010's | 4,811 | 5,017 | 4,539 | 5,871 | 3,576 | 3,038 | 3,254 | 2,789 | 2,502 | 2,018 |
| 2020's | 2,261 |
| - = No Data Reported; -- = Not Applicable; NA = Not Available; W = Withheld to avoid disclosure of individual company data. |
| Release Date: 2/9/2022 |
| Next Release Date: Suspended |