|
Download Data (XLS File) |
|
|||||
|
|||||
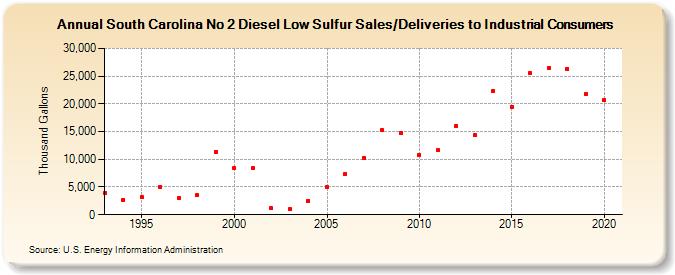
| South Carolina No 2 Diesel Low Sulfur Sales/Deliveries to Industrial Consumers (Thousand Gallons) | |||||
| Decade | Year-0 | Year-1 | Year-2 | Year-3 | Year-4 | Year-5 | Year-6 | Year-7 | Year-8 | Year-9 |
|---|---|---|---|---|---|---|---|---|---|---|
| 1990's | 3,954 | 2,725 | 3,143 | 5,005 | 2,950 | 3,523 | 11,398 | |||
| 2000's | 8,384 | 8,412 | 1,127 | 943 | 2,531 | 4,959 | 7,308 | 10,162 | 15,205 | 14,771 |
| 2010's | 10,801 | 11,595 | 16,008 | 14,328 | 22,353 | 19,442 | 25,480 | 26,506 | 26,302 | 21,811 |
| 2020's | 20,655 |
| - = No Data Reported; -- = Not Applicable; NA = Not Available; W = Withheld to avoid disclosure of individual company data. |
| Release Date: 2/9/2022 |
| Next Release Date: Suspended |