|
Download Data (XLS File) |
|
|||||
|
|||||
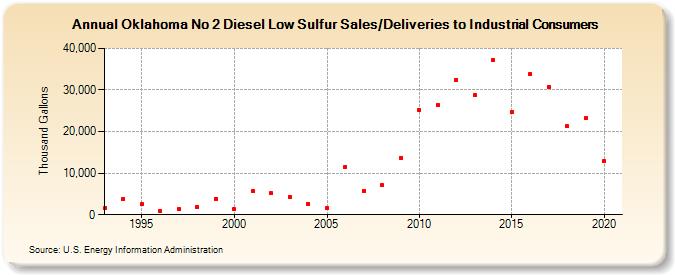
| Oklahoma No 2 Diesel Low Sulfur Sales/Deliveries to Industrial Consumers (Thousand Gallons) | |||||
| Decade | Year-0 | Year-1 | Year-2 | Year-3 | Year-4 | Year-5 | Year-6 | Year-7 | Year-8 | Year-9 |
|---|---|---|---|---|---|---|---|---|---|---|
| 1990's | 1,578 | 3,847 | 2,513 | 775 | 1,350 | 1,891 | 3,897 | |||
| 2000's | 1,302 | 5,631 | 5,156 | 4,270 | 2,673 | 1,702 | 11,542 | 5,793 | 7,064 | 13,756 |
| 2010's | 25,172 | 26,338 | 32,450 | 28,732 | 37,162 | 24,685 | 33,900 | 30,803 | 21,257 | 23,309 |
| 2020's | 12,857 |
| - = No Data Reported; -- = Not Applicable; NA = Not Available; W = Withheld to avoid disclosure of individual company data. |
| Release Date: 2/9/2022 |
| Next Release Date: Suspended |