|
Download Data (XLS File) |
|
|||||
|
|||||
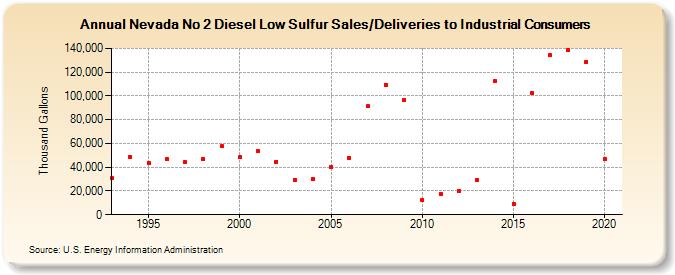
| Nevada No 2 Diesel Low Sulfur Sales/Deliveries to Industrial Consumers (Thousand Gallons) | |||||
| Decade | Year-0 | Year-1 | Year-2 | Year-3 | Year-4 | Year-5 | Year-6 | Year-7 | Year-8 | Year-9 |
|---|---|---|---|---|---|---|---|---|---|---|
| 1990's | 30,651 | 48,626 | 43,695 | 46,588 | 44,256 | 46,956 | 57,537 | |||
| 2000's | 48,336 | 53,521 | 44,708 | 29,592 | 29,942 | 40,181 | 48,035 | 91,090 | 109,562 | 96,724 |
| 2010's | 12,222 | 17,558 | 19,781 | 29,273 | 112,659 | 9,353 | 102,622 | 134,040 | 138,432 | 128,707 |
| 2020's | 46,548 |
| - = No Data Reported; -- = Not Applicable; NA = Not Available; W = Withheld to avoid disclosure of individual company data. |
| Release Date: 2/9/2022 |
| Next Release Date: Suspended |