|
Download Data (XLS File) |
|
|||||
|
|||||
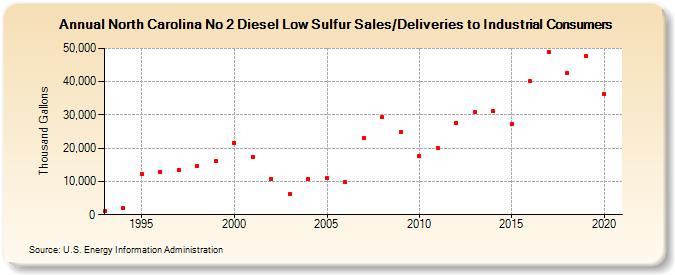
| North Carolina No 2 Diesel Low Sulfur Sales/Deliveries to Industrial Consumers (Thousand Gallons) | |||||
| Decade | Year-0 | Year-1 | Year-2 | Year-3 | Year-4 | Year-5 | Year-6 | Year-7 | Year-8 | Year-9 |
|---|---|---|---|---|---|---|---|---|---|---|
| 1990's | 1,033 | 1,870 | 12,345 | 12,930 | 13,542 | 14,568 | 16,194 | |||
| 2000's | 21,569 | 17,439 | 10,666 | 6,275 | 10,777 | 10,907 | 9,722 | 23,043 | 29,278 | 24,910 |
| 2010's | 17,799 | 19,971 | 27,706 | 30,817 | 31,111 | 27,161 | 40,051 | 48,947 | 42,458 | 47,670 |
| 2020's | 36,405 |
| - = No Data Reported; -- = Not Applicable; NA = Not Available; W = Withheld to avoid disclosure of individual company data. |
| Release Date: 2/9/2022 |
| Next Release Date: Suspended |