|
Download Data (XLS File) |
|
|||||
|
|||||
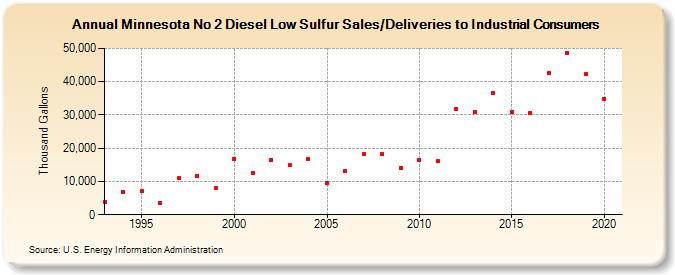
| Minnesota No 2 Diesel Low Sulfur Sales/Deliveries to Industrial Consumers (Thousand Gallons) | |||||
| Decade | Year-0 | Year-1 | Year-2 | Year-3 | Year-4 | Year-5 | Year-6 | Year-7 | Year-8 | Year-9 |
|---|---|---|---|---|---|---|---|---|---|---|
| 1990's | 3,949 | 6,782 | 6,986 | 3,409 | 10,889 | 11,646 | 7,924 | |||
| 2000's | 16,868 | 12,685 | 16,526 | 14,839 | 16,750 | 9,448 | 13,190 | 18,309 | 18,274 | 14,063 |
| 2010's | 16,500 | 16,153 | 31,816 | 30,774 | 36,646 | 30,886 | 30,617 | 42,605 | 48,484 | 42,338 |
| 2020's | 34,906 |
| - = No Data Reported; -- = Not Applicable; NA = Not Available; W = Withheld to avoid disclosure of individual company data. |
| Release Date: 2/9/2022 |
| Next Release Date: Suspended |