|
Download Data (XLS File) |
|
|||||
|
|||||
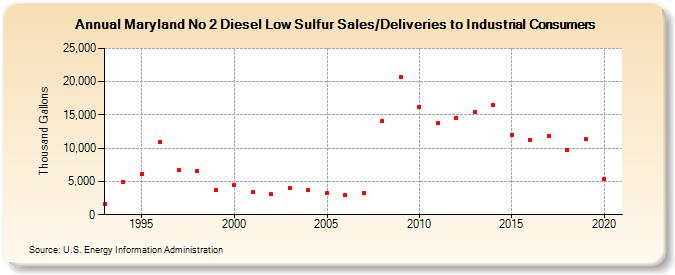
| Maryland No 2 Diesel Low Sulfur Sales/Deliveries to Industrial Consumers (Thousand Gallons) | |||||
| Decade | Year-0 | Year-1 | Year-2 | Year-3 | Year-4 | Year-5 | Year-6 | Year-7 | Year-8 | Year-9 |
|---|---|---|---|---|---|---|---|---|---|---|
| 1990's | 1,602 | 4,989 | 6,126 | 10,869 | 6,705 | 6,590 | 3,775 | |||
| 2000's | 4,476 | 3,342 | 3,050 | 3,954 | 3,722 | 3,207 | 2,947 | 3,307 | 14,015 | 20,649 |
| 2010's | 16,121 | 13,755 | 14,598 | 15,493 | 16,473 | 12,040 | 11,286 | 11,832 | 9,692 | 11,367 |
| 2020's | 5,441 |
| - = No Data Reported; -- = Not Applicable; NA = Not Available; W = Withheld to avoid disclosure of individual company data. |
| Release Date: 2/9/2022 |
| Next Release Date: Suspended |