|
Download Data (XLS File) |
|
|||||
|
|||||
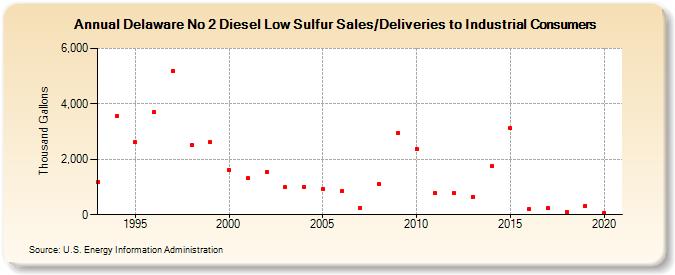
| Delaware No 2 Diesel Low Sulfur Sales/Deliveries to Industrial Consumers (Thousand Gallons) | |||||
| Decade | Year-0 | Year-1 | Year-2 | Year-3 | Year-4 | Year-5 | Year-6 | Year-7 | Year-8 | Year-9 |
|---|---|---|---|---|---|---|---|---|---|---|
| 1990's | 1,168 | 3,546 | 2,608 | 3,708 | 5,183 | 2,501 | 2,608 | |||
| 2000's | 1,619 | 1,319 | 1,552 | 988 | 1,011 | 930 | 852 | 248 | 1,091 | 2,955 |
| 2010's | 2,373 | 772 | 783 | 652 | 1,744 | 3,118 | 205 | 226 | 86 | 326 |
| 2020's | 64 |
| - = No Data Reported; -- = Not Applicable; NA = Not Available; W = Withheld to avoid disclosure of individual company data. |
| Release Date: 2/9/2022 |
| Next Release Date: Suspended |