|
Download Data (XLS File) |
|
|||||
|
|||||
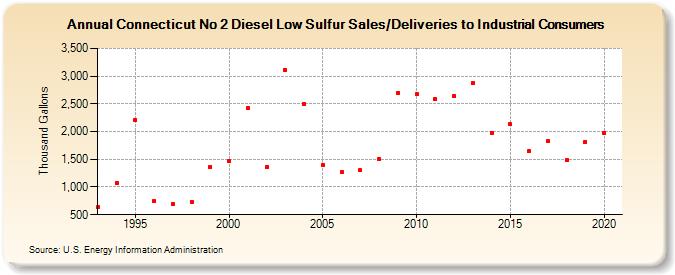
| Connecticut No 2 Diesel Low Sulfur Sales/Deliveries to Industrial Consumers (Thousand Gallons) | |||||
| Decade | Year-0 | Year-1 | Year-2 | Year-3 | Year-4 | Year-5 | Year-6 | Year-7 | Year-8 | Year-9 |
|---|---|---|---|---|---|---|---|---|---|---|
| 1990's | 635 | 1,073 | 2,211 | 747 | 693 | 736 | 1,368 | |||
| 2000's | 1,466 | 2,421 | 1,358 | 3,106 | 2,494 | 1,394 | 1,263 | 1,301 | 1,499 | 2,696 |
| 2010's | 2,675 | 2,583 | 2,642 | 2,879 | 1,975 | 2,130 | 1,643 | 1,823 | 1,486 | 1,816 |
| 2020's | 1,982 |
| - = No Data Reported; -- = Not Applicable; NA = Not Available; W = Withheld to avoid disclosure of individual company data. |
| Release Date: 2/9/2022 |
| Next Release Date: Suspended |