|
Download Data (XLS File) |
|
|||||
|
|||||
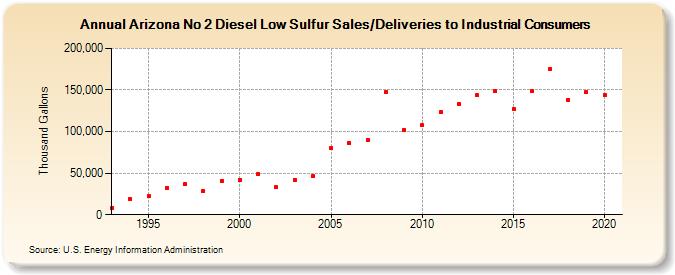
| Arizona No 2 Diesel Low Sulfur Sales/Deliveries to Industrial Consumers (Thousand Gallons) | |||||
| Decade | Year-0 | Year-1 | Year-2 | Year-3 | Year-4 | Year-5 | Year-6 | Year-7 | Year-8 | Year-9 |
|---|---|---|---|---|---|---|---|---|---|---|
| 1990's | 7,874 | 18,600 | 22,400 | 32,678 | 36,514 | 28,211 | 40,648 | |||
| 2000's | 41,863 | 49,242 | 32,950 | 42,077 | 46,122 | 79,936 | 86,355 | 89,743 | 147,717 | 101,586 |
| 2010's | 107,469 | 123,437 | 133,250 | 143,435 | 148,458 | 127,167 | 148,317 | 174,950 | 138,382 | 147,022 |
| 2020's | 143,813 |
| - = No Data Reported; -- = Not Applicable; NA = Not Available; W = Withheld to avoid disclosure of individual company data. |
| Release Date: 2/9/2022 |
| Next Release Date: Suspended |