|
Download Data (XLS File) |
|
|||||
|
|||||
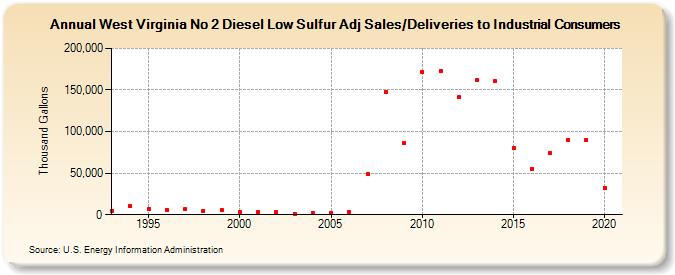
| West Virginia No 2 Diesel Low Sulfur Adj Sales/Deliveries to Industrial Consumers (Thousand Gallons) | |||||
| Decade | Year-0 | Year-1 | Year-2 | Year-3 | Year-4 | Year-5 | Year-6 | Year-7 | Year-8 | Year-9 |
|---|---|---|---|---|---|---|---|---|---|---|
| 1990's | 4,712 | 10,766 | 7,161 | 6,270 | 6,454 | 4,948 | 6,153 | |||
| 2000's | 3,254 | 3,834 | 2,953 | 1,452 | 1,856 | 1,966 | 3,467 | 48,366 | 147,733 | 85,709 |
| 2010's | 171,739 | 172,875 | 141,237 | 162,498 | 160,692 | 80,375 | 55,567 | 74,294 | 89,738 | 89,774 |
| 2020's | 32,712 |
| - = No Data Reported; -- = Not Applicable; NA = Not Available; W = Withheld to avoid disclosure of individual company data. |
| Release Date: 2/9/2022 |
| Next Release Date: Suspended |