|
Download Data (XLS File) |
|
|||||
|
|||||
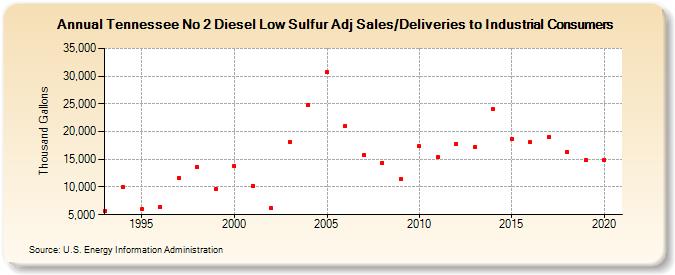
| Tennessee No 2 Diesel Low Sulfur Adj Sales/Deliveries to Industrial Consumers (Thousand Gallons) | |||||
| Decade | Year-0 | Year-1 | Year-2 | Year-3 | Year-4 | Year-5 | Year-6 | Year-7 | Year-8 | Year-9 |
|---|---|---|---|---|---|---|---|---|---|---|
| 1990's | 5,716 | 9,974 | 5,959 | 6,480 | 11,658 | 13,563 | 9,593 | |||
| 2000's | 13,735 | 10,261 | 6,200 | 18,183 | 24,801 | 30,751 | 20,960 | 15,810 | 14,395 | 11,388 |
| 2010's | 17,333 | 15,385 | 17,799 | 17,239 | 24,016 | 18,632 | 18,028 | 19,045 | 16,329 | 14,834 |
| 2020's | 14,954 |
| - = No Data Reported; -- = Not Applicable; NA = Not Available; W = Withheld to avoid disclosure of individual company data. |
| Release Date: 2/9/2022 |
| Next Release Date: Suspended |