|
Download Data (XLS File) |
|
|||||
|
|||||
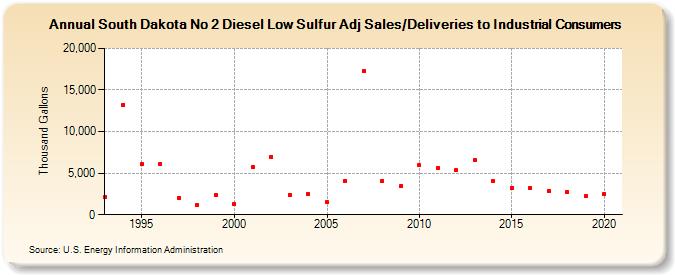
| South Dakota No 2 Diesel Low Sulfur Adj Sales/Deliveries to Industrial Consumers (Thousand Gallons) | |||||
| Decade | Year-0 | Year-1 | Year-2 | Year-3 | Year-4 | Year-5 | Year-6 | Year-7 | Year-8 | Year-9 |
|---|---|---|---|---|---|---|---|---|---|---|
| 1990's | 2,084 | 13,226 | 6,096 | 6,093 | 2,028 | 1,170 | 2,339 | |||
| 2000's | 1,313 | 5,698 | 6,978 | 2,404 | 2,496 | 1,491 | 4,047 | 17,279 | 4,037 | 3,433 |
| 2010's | 5,934 | 5,676 | 5,324 | 6,537 | 4,020 | 3,223 | 3,261 | 2,837 | 2,757 | 2,201 |
| 2020's | 2,495 |
| - = No Data Reported; -- = Not Applicable; NA = Not Available; W = Withheld to avoid disclosure of individual company data. |
| Release Date: 2/9/2022 |
| Next Release Date: Suspended |