|
Download Data (XLS File) |
|
|||||
|
|||||
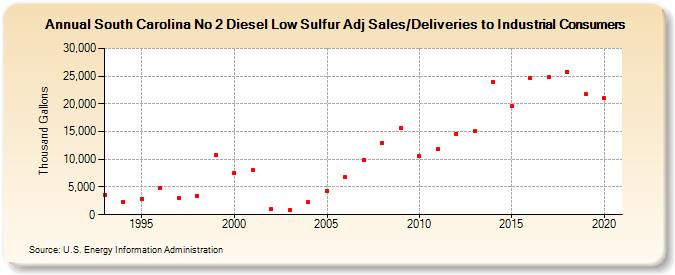
| South Carolina No 2 Diesel Low Sulfur Adj Sales/Deliveries to Industrial Consumers (Thousand Gallons) | |||||
| Decade | Year-0 | Year-1 | Year-2 | Year-3 | Year-4 | Year-5 | Year-6 | Year-7 | Year-8 | Year-9 |
|---|---|---|---|---|---|---|---|---|---|---|
| 1990's | 3,569 | 2,340 | 2,897 | 4,908 | 2,938 | 3,433 | 10,851 | |||
| 2000's | 7,554 | 7,997 | 1,048 | 845 | 2,208 | 4,325 | 6,758 | 9,827 | 12,924 | 15,598 |
| 2010's | 10,565 | 11,801 | 14,635 | 15,045 | 23,884 | 19,548 | 24,614 | 24,769 | 25,819 | 21,692 |
| 2020's | 21,039 |
| - = No Data Reported; -- = Not Applicable; NA = Not Available; W = Withheld to avoid disclosure of individual company data. |
| Release Date: 2/9/2022 |
| Next Release Date: Suspended |