|
Download Data (XLS File) |
|
|||||
|
|||||
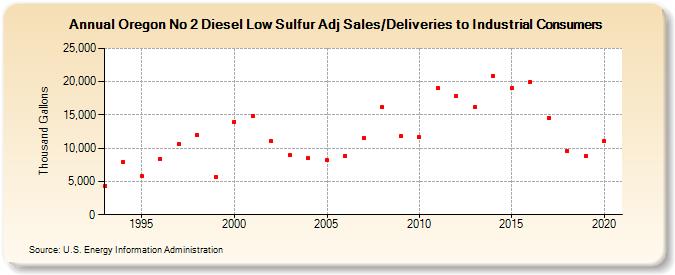
| Oregon No 2 Diesel Low Sulfur Adj Sales/Deliveries to Industrial Consumers (Thousand Gallons) | |||||
| Decade | Year-0 | Year-1 | Year-2 | Year-3 | Year-4 | Year-5 | Year-6 | Year-7 | Year-8 | Year-9 |
|---|---|---|---|---|---|---|---|---|---|---|
| 1990's | 4,322 | 7,893 | 5,840 | 8,377 | 10,686 | 11,976 | 5,736 | |||
| 2000's | 14,002 | 14,816 | 11,037 | 8,966 | 8,464 | 8,151 | 8,853 | 11,590 | 16,161 | 11,767 |
| 2010's | 11,637 | 19,055 | 17,827 | 16,226 | 20,897 | 18,975 | 19,957 | 14,549 | 9,623 | 8,807 |
| 2020's | 11,016 |
| - = No Data Reported; -- = Not Applicable; NA = Not Available; W = Withheld to avoid disclosure of individual company data. |
| Release Date: 2/9/2022 |
| Next Release Date: Suspended |