|
Download Data (XLS File) |
|
|||||
|
|||||
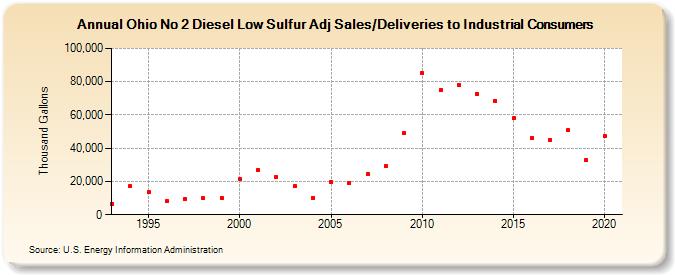
| Ohio No 2 Diesel Low Sulfur Adj Sales/Deliveries to Industrial Consumers (Thousand Gallons) | |||||
| Decade | Year-0 | Year-1 | Year-2 | Year-3 | Year-4 | Year-5 | Year-6 | Year-7 | Year-8 | Year-9 |
|---|---|---|---|---|---|---|---|---|---|---|
| 1990's | 6,567 | 16,973 | 13,474 | 8,073 | 9,597 | 9,790 | 10,331 | |||
| 2000's | 21,256 | 26,900 | 22,661 | 16,978 | 10,304 | 19,594 | 19,301 | 24,440 | 29,214 | 49,056 |
| 2010's | 85,164 | 74,885 | 77,935 | 72,774 | 68,532 | 57,907 | 46,351 | 45,060 | 50,856 | 32,788 |
| 2020's | 47,186 |
| - = No Data Reported; -- = Not Applicable; NA = Not Available; W = Withheld to avoid disclosure of individual company data. |
| Release Date: 2/9/2022 |
| Next Release Date: Suspended |