|
Download Data (XLS File) |
|
|||||
|
|||||
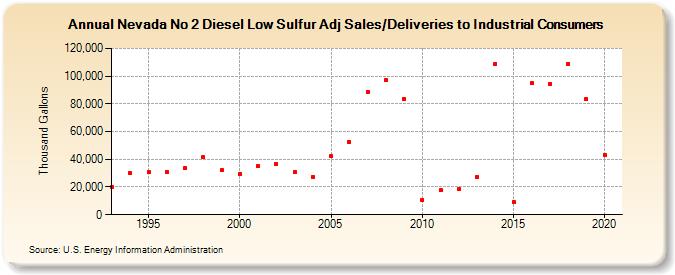
| Nevada No 2 Diesel Low Sulfur Adj Sales/Deliveries to Industrial Consumers (Thousand Gallons) | |||||
| Decade | Year-0 | Year-1 | Year-2 | Year-3 | Year-4 | Year-5 | Year-6 | Year-7 | Year-8 | Year-9 |
|---|---|---|---|---|---|---|---|---|---|---|
| 1990's | 19,896 | 30,024 | 30,693 | 30,663 | 33,572 | 41,382 | 32,235 | |||
| 2000's | 29,661 | 34,970 | 36,812 | 30,531 | 27,432 | 42,025 | 52,557 | 88,781 | 97,368 | 83,626 |
| 2010's | 10,916 | 17,694 | 18,480 | 27,238 | 109,002 | 9,344 | 94,870 | 94,489 | 108,845 | 83,508 |
| 2020's | 43,385 |
| - = No Data Reported; -- = Not Applicable; NA = Not Available; W = Withheld to avoid disclosure of individual company data. |
| Release Date: 2/9/2022 |
| Next Release Date: Suspended |