|
Download Data (XLS File) |
|
|||||
|
|||||
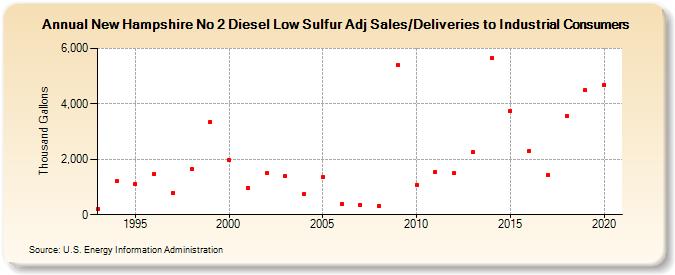
| New Hampshire No 2 Diesel Low Sulfur Adj Sales/Deliveries to Industrial Consumers (Thousand Gallons) | |||||
| Decade | Year-0 | Year-1 | Year-2 | Year-3 | Year-4 | Year-5 | Year-6 | Year-7 | Year-8 | Year-9 |
|---|---|---|---|---|---|---|---|---|---|---|
| 1990's | 209 | 1,203 | 1,116 | 1,486 | 784 | 1,641 | 3,359 | |||
| 2000's | 1,960 | 969 | 1,491 | 1,384 | 750 | 1,344 | 400 | 365 | 321 | 5,400 |
| 2010's | 1,087 | 1,556 | 1,491 | 2,255 | 5,657 | 3,748 | 2,308 | 1,427 | 3,555 | 4,486 |
| 2020's | 4,691 |
| - = No Data Reported; -- = Not Applicable; NA = Not Available; W = Withheld to avoid disclosure of individual company data. |
| Release Date: 2/9/2022 |
| Next Release Date: Suspended |