|
Download Data (XLS File) |
|
|||||
|
|||||
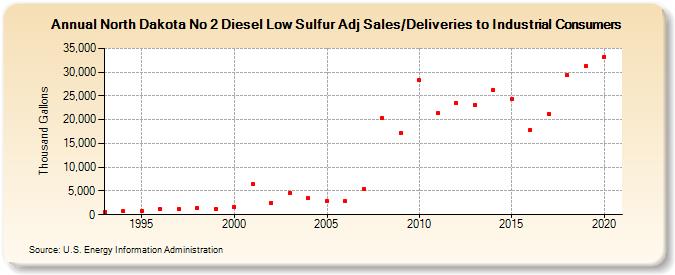
| North Dakota No 2 Diesel Low Sulfur Adj Sales/Deliveries to Industrial Consumers (Thousand Gallons) | |||||
| Decade | Year-0 | Year-1 | Year-2 | Year-3 | Year-4 | Year-5 | Year-6 | Year-7 | Year-8 | Year-9 |
|---|---|---|---|---|---|---|---|---|---|---|
| 1990's | 633 | 725 | 759 | 1,159 | 1,144 | 1,431 | 1,159 | |||
| 2000's | 1,603 | 6,362 | 2,529 | 4,616 | 3,426 | 2,843 | 2,791 | 5,423 | 20,361 | 17,122 |
| 2010's | 28,247 | 21,326 | 23,455 | 23,152 | 26,247 | 24,267 | 17,924 | 21,224 | 29,345 | 31,295 |
| 2020's | 33,207 |
| - = No Data Reported; -- = Not Applicable; NA = Not Available; W = Withheld to avoid disclosure of individual company data. |
| Release Date: 2/9/2022 |
| Next Release Date: Suspended |