|
Download Data (XLS File) |
|
|||||
|
|||||
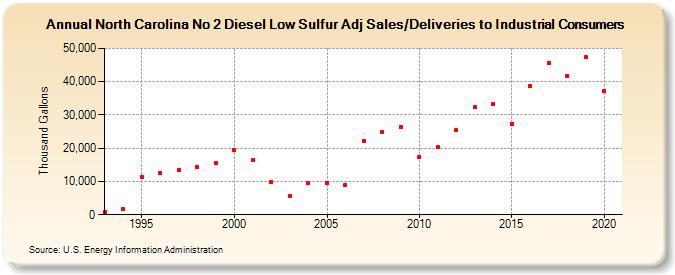
| North Carolina No 2 Diesel Low Sulfur Adj Sales/Deliveries to Industrial Consumers (Thousand Gallons) | |||||
| Decade | Year-0 | Year-1 | Year-2 | Year-3 | Year-4 | Year-5 | Year-6 | Year-7 | Year-8 | Year-9 |
|---|---|---|---|---|---|---|---|---|---|---|
| 1990's | 932 | 1,606 | 11,379 | 12,679 | 13,486 | 14,194 | 15,417 | |||
| 2000's | 19,435 | 16,578 | 9,918 | 5,628 | 9,403 | 9,511 | 8,991 | 22,286 | 24,887 | 26,306 |
| 2010's | 17,411 | 20,325 | 25,331 | 32,359 | 33,242 | 27,308 | 38,691 | 45,739 | 41,678 | 47,411 |
| 2020's | 37,082 |
| - = No Data Reported; -- = Not Applicable; NA = Not Available; W = Withheld to avoid disclosure of individual company data. |
| Release Date: 2/9/2022 |
| Next Release Date: Suspended |