|
Download Data (XLS File) |
|
|||||
|
|||||
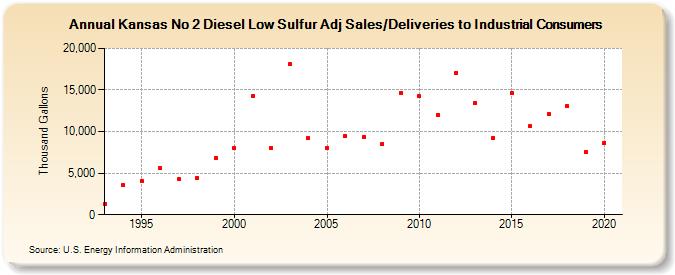
| Kansas No 2 Diesel Low Sulfur Adj Sales/Deliveries to Industrial Consumers (Thousand Gallons) | |||||
| Decade | Year-0 | Year-1 | Year-2 | Year-3 | Year-4 | Year-5 | Year-6 | Year-7 | Year-8 | Year-9 |
|---|---|---|---|---|---|---|---|---|---|---|
| 1990's | 1,289 | 3,540 | 4,108 | 5,565 | 4,282 | 4,393 | 6,860 | |||
| 2000's | 8,040 | 14,310 | 8,000 | 18,117 | 9,174 | 8,002 | 9,470 | 9,376 | 8,563 | 14,645 |
| 2010's | 14,225 | 12,027 | 17,078 | 13,469 | 9,282 | 14,666 | 10,635 | 12,067 | 13,058 | 7,583 |
| 2020's | 8,682 |
| - = No Data Reported; -- = Not Applicable; NA = Not Available; W = Withheld to avoid disclosure of individual company data. |
| Release Date: 2/9/2022 |
| Next Release Date: Suspended |