|
Download Data (XLS File) |
|
|||||
|
|||||
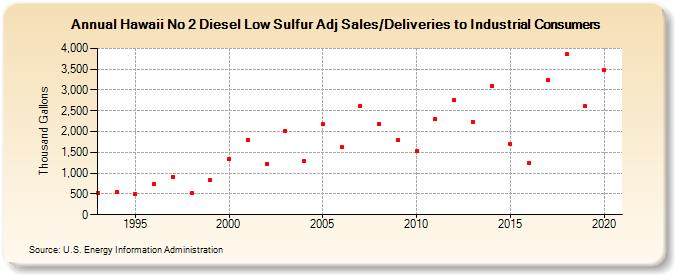
| Hawaii No 2 Diesel Low Sulfur Adj Sales/Deliveries to Industrial Consumers (Thousand Gallons) | |||||
| Decade | Year-0 | Year-1 | Year-2 | Year-3 | Year-4 | Year-5 | Year-6 | Year-7 | Year-8 | Year-9 |
|---|---|---|---|---|---|---|---|---|---|---|
| 1990's | 524 | 539 | 495 | 740 | 913 | 520 | 841 | |||
| 2000's | 1,336 | 1,804 | 1,216 | 2,020 | 1,284 | 2,173 | 1,619 | 2,621 | 2,188 | 1,791 |
| 2010's | 1,532 | 2,294 | 2,758 | 2,237 | 3,103 | 1,700 | 1,254 | 3,236 | 3,861 | 2,603 |
| 2020's | 3,474 |
| - = No Data Reported; -- = Not Applicable; NA = Not Available; W = Withheld to avoid disclosure of individual company data. |
| Release Date: 2/9/2022 |
| Next Release Date: Suspended |