|
Download Data (XLS File) |
|
|||||
|
|||||
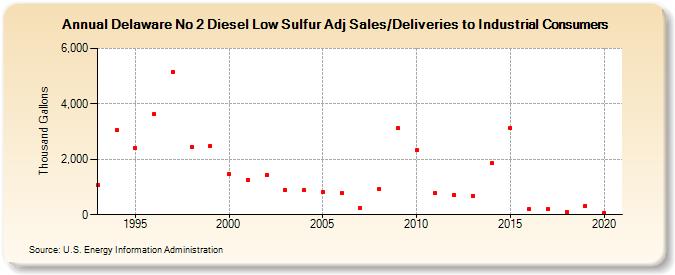
| Delaware No 2 Diesel Low Sulfur Adj Sales/Deliveries to Industrial Consumers (Thousand Gallons) | |||||
| Decade | Year-0 | Year-1 | Year-2 | Year-3 | Year-4 | Year-5 | Year-6 | Year-7 | Year-8 | Year-9 |
|---|---|---|---|---|---|---|---|---|---|---|
| 1990's | 1,054 | 3,045 | 2,404 | 3,636 | 5,162 | 2,436 | 2,483 | |||
| 2000's | 1,459 | 1,253 | 1,444 | 886 | 882 | 811 | 787 | 240 | 927 | 3,120 |
| 2010's | 2,322 | 786 | 716 | 685 | 1,863 | 3,135 | 198 | 211 | 84 | 325 |
| 2020's | 65 |
| - = No Data Reported; -- = Not Applicable; NA = Not Available; W = Withheld to avoid disclosure of individual company data. |
| Release Date: 2/9/2022 |
| Next Release Date: Suspended |