|
Download Data (XLS File) |
|
|||||
|
|||||
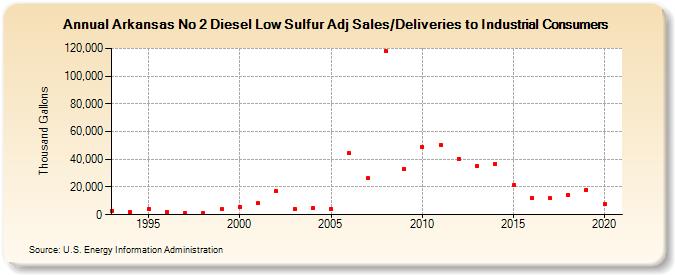
| Arkansas No 2 Diesel Low Sulfur Adj Sales/Deliveries to Industrial Consumers (Thousand Gallons) | |||||
| Decade | Year-0 | Year-1 | Year-2 | Year-3 | Year-4 | Year-5 | Year-6 | Year-7 | Year-8 | Year-9 |
|---|---|---|---|---|---|---|---|---|---|---|
| 1990's | 2,936 | 1,948 | 4,185 | 1,923 | 1,151 | 1,418 | 4,212 | |||
| 2000's | 5,407 | 8,179 | 16,900 | 4,433 | 4,692 | 4,315 | 44,244 | 26,150 | 118,409 | 33,302 |
| 2010's | 48,957 | 50,421 | 40,349 | 34,847 | 36,749 | 21,289 | 12,283 | 11,729 | 14,203 | 18,137 |
| 2020's | 7,709 |
| - = No Data Reported; -- = Not Applicable; NA = Not Available; W = Withheld to avoid disclosure of individual company data. |
| Release Date: 2/9/2022 |
| Next Release Date: Suspended |