|
Download Data (XLS File) |
|
|||||
|
|||||
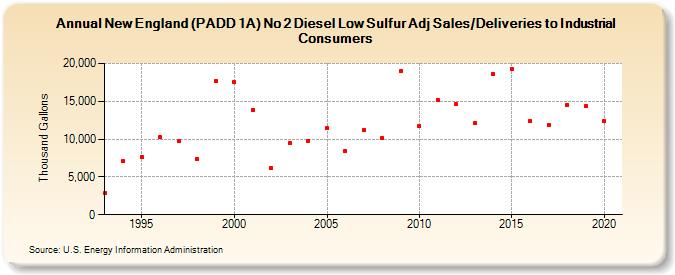
| New England (PADD 1A) No 2 Diesel Low Sulfur Adj Sales/Deliveries to Industrial Consumers (Thousand Gallons) | |||||
| Decade | Year-0 | Year-1 | Year-2 | Year-3 | Year-4 | Year-5 | Year-6 | Year-7 | Year-8 | Year-9 |
|---|---|---|---|---|---|---|---|---|---|---|
| 1990's | 2,840 | 7,102 | 7,623 | 10,234 | 9,726 | 7,359 | 17,723 | |||
| 2000's | 17,498 | 13,894 | 6,210 | 9,490 | 9,785 | 11,410 | 8,409 | 11,248 | 10,086 | 19,008 |
| 2010's | 11,673 | 15,147 | 14,606 | 12,159 | 18,625 | 19,276 | 12,368 | 11,894 | 14,536 | 14,386 |
| 2020's | 12,375 |
| - = No Data Reported; -- = Not Applicable; NA = Not Available; W = Withheld to avoid disclosure of individual company data. |
| Release Date: 2/9/2022 |
| Next Release Date: Suspended |