|
Download Data (XLS File) |
|
|||||
|
|||||
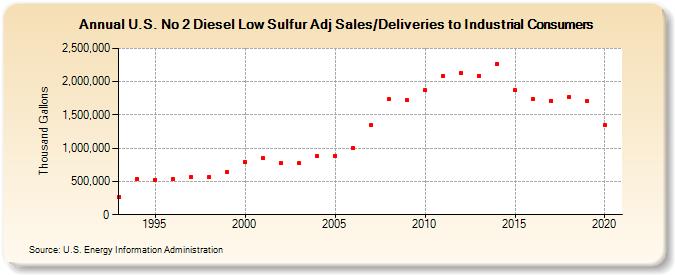
| U.S. No 2 Diesel Low Sulfur Adj Sales/Deliveries to Industrial Consumers (Thousand Gallons) | |||||
| Decade | Year-0 | Year-1 | Year-2 | Year-3 | Year-4 | Year-5 | Year-6 | Year-7 | Year-8 | Year-9 |
|---|---|---|---|---|---|---|---|---|---|---|
| 1990's | 273,392 | 544,205 | 529,239 | 541,074 | 573,200 | 570,126 | 636,715 | |||
| 2000's | 797,917 | 850,880 | 778,272 | 772,079 | 875,397 | 884,053 | 1,002,912 | 1,347,657 | 1,733,132 | 1,720,134 |
| 2010's | 1,870,156 | 2,088,187 | 2,128,214 | 2,090,682 | 2,272,200 | 1,872,489 | 1,746,071 | 1,715,353 | 1,771,866 | 1,702,590 |
| 2020's | 1,349,734 |
| - = No Data Reported; -- = Not Applicable; NA = Not Available; W = Withheld to avoid disclosure of individual company data. |
| Release Date: 2/9/2022 |
| Next Release Date: Suspended |