|
Download Data (XLS File) |
|
|||||
|
|||||
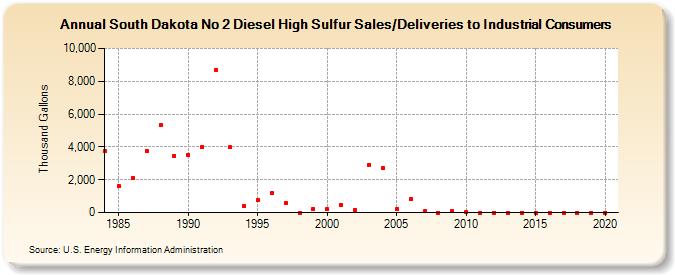
| South Dakota No 2 Diesel High Sulfur Sales/Deliveries to Industrial Consumers (Thousand Gallons) | |||||
| Decade | Year-0 | Year-1 | Year-2 | Year-3 | Year-4 | Year-5 | Year-6 | Year-7 | Year-8 | Year-9 |
|---|---|---|---|---|---|---|---|---|---|---|
| 1980's | 3,745 | 1,611 | 2,107 | 3,746 | 5,319 | 3,475 | ||||
| 1990's | 3,524 | 4,003 | 8,710 | 3,973 | 395 | 784 | 1,189 | 587 | 0 | 243 |
| 2000's | 194 | 478 | 175 | 2,909 | 2,699 | 213 | 813 | 74 | 0 | 90 |
| 2010's | 43 | 0 | 0 | 0 | 0 | 0 | 0 | 0 | 0 | 0 |
| 2020's | 0 |
| - = No Data Reported; -- = Not Applicable; NA = Not Available; W = Withheld to avoid disclosure of individual company data. |
| Release Date: 2/9/2022 |
| Next Release Date: Suspended |